Series
The Series function is used to send a list of items (categories). A typical use would be to create the values for the X-axis when the X-axis is not based on numerical values.
Lib.Data.Series("Name", [Col]) = Data
Name (String) the Name of the series to create
Col (Optional Boolean) Default=False. By default the series is created in 1xN format as show below. To switch it to Nx1 format, set to 'True'
Data: (various) The values that will form the series
Data can be in a number of different forms
- Array of values - for example dates
- String with either ' ; ' or ' , ' separating the values. Note that ' ; ' has priority over ' , '
Example:
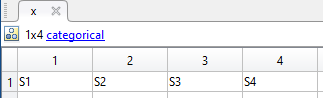
Lib.Data.Series("x") = "s1, s2, s3, s4"
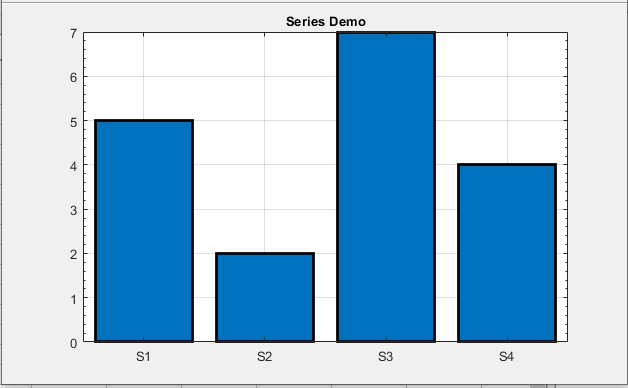
Example:
Lib.Data.Series("x") = "S1, S2, S3, S4"
Lib.Execute "y = [5 2 7 4]"
Dim plot As Object
Set plot = Lib.Figure.plot(1)
plot.Caption = "Series Demo"
plot.Signal(1).Form = eForm.Bar
plot.Signal(1).Name = "y"
plot.Index.Name = "x"
Lib.Figure.Display