Display
Display the contents of the selected Plots data
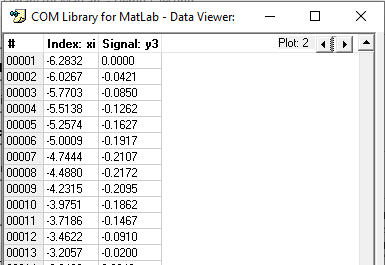
Lib.Data.Display
This displays the contents of the data for the current Plot in MatLab.
This is most useful when you are not running MatLab in desktop mode.
Notes on Display Formatting:
The configuration Data Format allows you to have control of the formatting of the data.
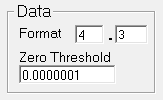
Format allows for the setting of the number of digits to the Left (interger) and Right (fractional) of the decimal point.
Zero Threshold allows setting the value to "0" when the value is sufficiently low. This helps prevent minor rounding errors values like "2.4492935E-16" showing.
It also provides additional controls:
- 0.00001: Will set the value to 0 when <0.00001
- 0 Turns off zero thresholding so all values will be displayed
- -1 Turns off the formatting functionality entirely
Using the example setting above:
Input: Output:
0.1111111 0.111
0.000333 3.33e-4
1234.5555 1,234.556
1.234E11 1,234e8
555555555 5,556e5
2.4492935E-16 0
Note: This configuration setting can be overwritten programmatically with the Data.Format property as needed.