By Command
With this example uses the Command plot feature to create a waterfall plot.
The Commands used were: waterfall(z) | colormap(jet) | colorbar
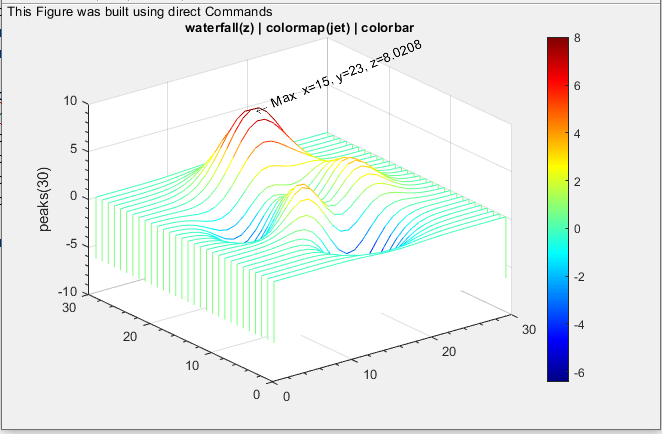
Lib.Figure.Information = "This Figure was built using direct Commands"
Lib.Execute "peaks(30)"
Lib.Figure.Plot(1).Command = " waterfall(z) | colormap(jet) | colorbar "
Lib.Figure.Plot(1).Caption = Lib.Figure.Plot(1).Command
Dim mkr As MarkerPart
Set mkr = Lib.Figure.Plot(1).Marker(1).Point
mkr.Caption.Text = "Max"
Lib.execute "[m, i] = max(z(:))"
Lib.execute "[r, c] = ind2sub(size(z),i)"
mkr.Location.z = Lib.Data.Value("m")
mkr.Location.x = Lib.Data.Value("c")
mkr.Location.Y = Lib.Data.Value("r")
Lib.Figure.Display